In this report I will look at a set of data on chess games played at lichess. There is a dashboard for the collected data which can be observed for further examination.
I used the available dataset to answer a few questions:
- What are the most used opening strategies?
- Which strategies have the highest win percentages?
- Are there any corelation between the amount of time a strategy is played and It’s rate of success?
I will try to answer all of these in this report.
Strategy’s

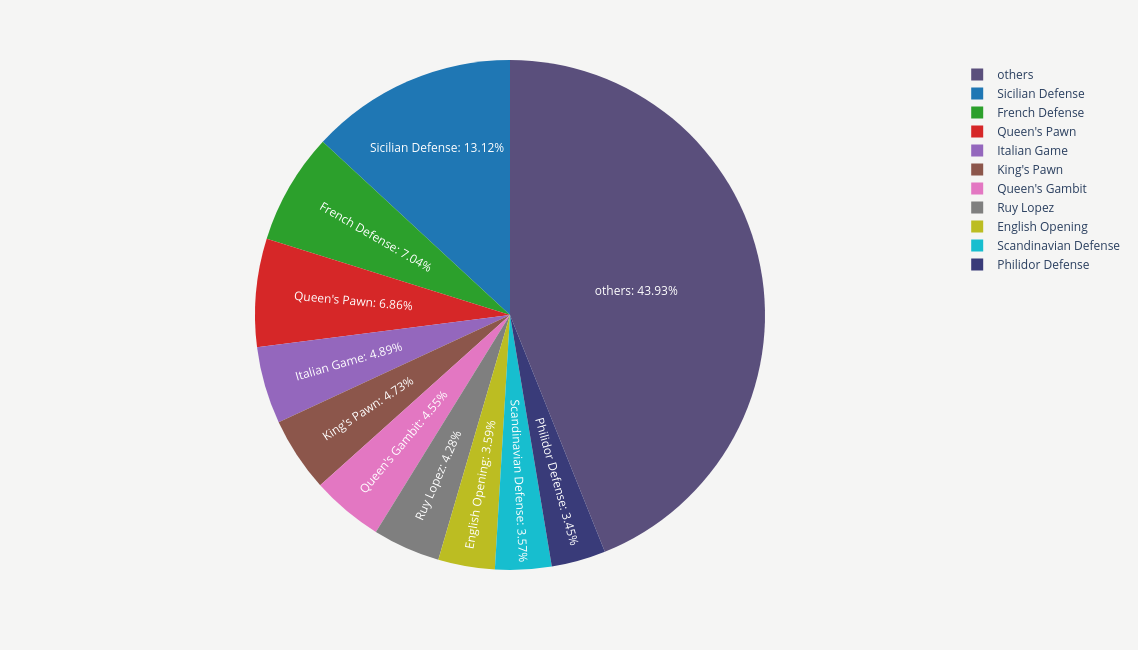
The above image shows the distribution of different strategies sorted in a descending order. Most of these strategies are used by nearly no one. There are 119 different strategies in this dataset. We can clearly observe that the highest used strategy is the Sicilian defense & even after that we have the french defence. This indicates that players usually will not accept an open game and would try to make their own strategy.
More than 50% of times a defensive strategy is utilized against the white attacks, Meaning the player on the black side has a strategy against the white and will not play into his game. Now we should observe how many times these tactics worked:
Tactics

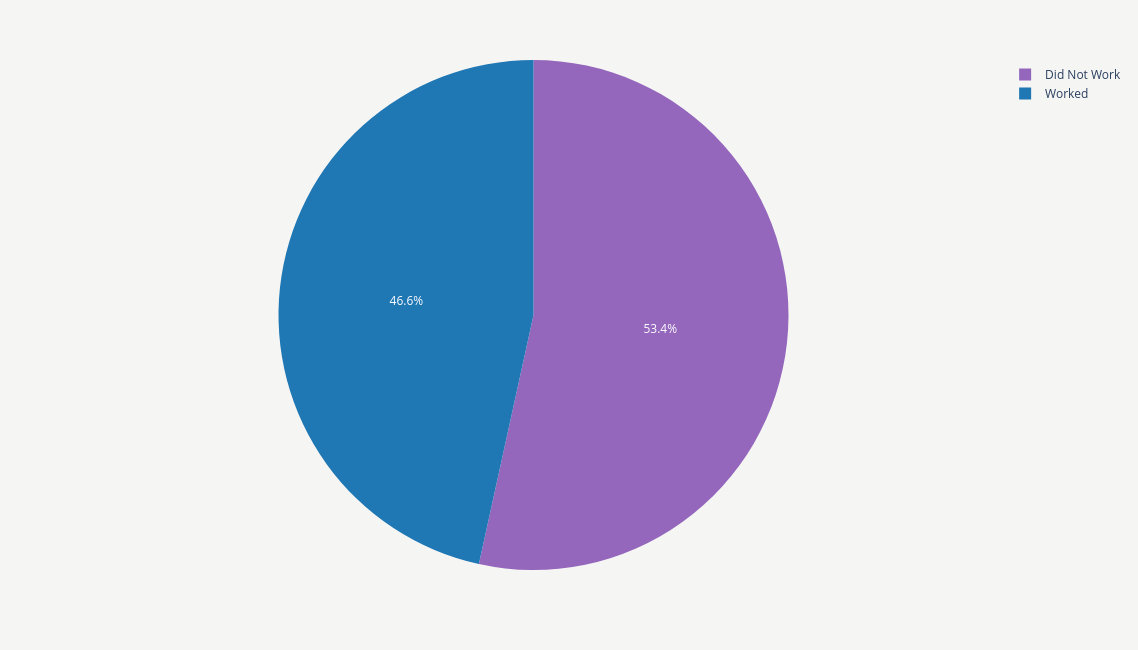
For the result above I considered ‘defensive’ tactics as moves done by the black side to try and achieve an upper hand against the white, So I tallied their wins for them in their strategies working out.
On the other hand, Any other tactic would be ‘offensive’ maneuvers done by the white side player to try and claim victory. These wins were counted as their stratgeis working.
With all that, We can see most of the times the strategies did not pan out. With the success rate being 46%, We can say that the mid games are not very clean for most of the users.
Distribution

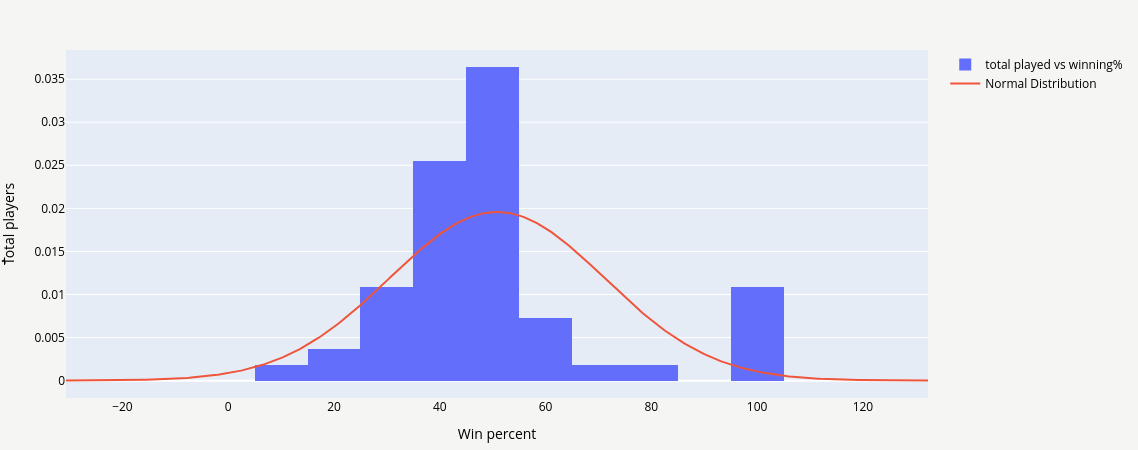
After that, My question was how do the strategies fare with the number of players using them? My initial thought was that the more the number of players, The lower the result. But as we can see the distribution of players over different strategies compared to the percentage of them winning, We can see that It follows somewhat like a a normal distribution! This means most of our users fall in the middle of the pack while some manage to out maneuver their opponent.
Strategies: In depth

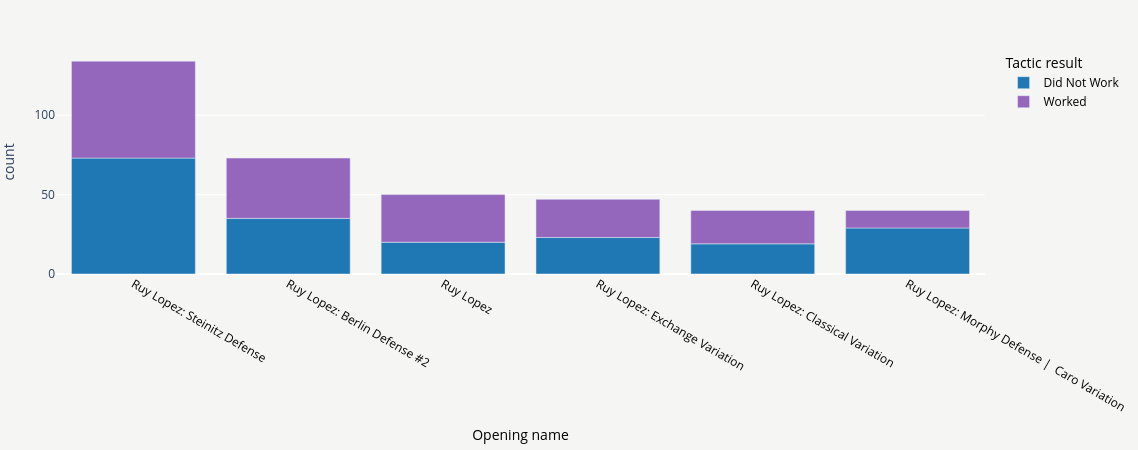
In the last segment of this analysis, I wanted to focus on specific strategies. You can see the top 10 strategy in my dashboard mentioned above. However, I wanted to look at one of them more in depth. The Ruy Lopez opening is one of the oldest openings in chess. The fact that most of these played games would go into Steinitz, Berlin or even Murphy defense.
All of these defenses are great options against it. These show the fact that knowingly or otherwise, Many are prepared for one of the most historic openings in chess.
Conclusion
One day I would like to come back to this analysis with more recent data. There are also a lot more data which I decided to not include, like effects of castling on the winner, Whether same-side or opposite-side castling have any effects on the result and so much more but alas, I decided to keep this one short.
The code for the dashboard can be found here